New Products
UC-win/Road Ver.6 sample model
3D real-time VR software

Price: New purchase
Ultimate:1,575,000 yen
Driving Sim:1,260,000 yen
Advanced:945,000 yen
Standard:609,000 yen
Upgrade Ultimate:420,000 yen
Driving Sim:341,250
yen
Advanced:262,500 yen
Standard:157,500 yen
Released on December 14, 2011
Simulation

 VR model for urban design
City Design.rd
This is a data created with the purpose of visualizing a large scale city environment and a high quality city, in which data that covers an extensive area with  the city of Kyoto as its center and the data covering the vicinity of Shibuya station are arranged into one with an emphasis on "Digital City".

Crowd movement in 3D
We constructed a network of pedestrian's walking routes (pathways) in 3D space and developed crowd movement function that allows many characters to walk on their pathways. Several pedestrians can be arranged at once, and pedestrians can now determine their own routes to walk on and can avoid bumping against each other. The result of this development is that the visual reality is improved as well as the time required for arranging multiple numbers of pedestrians (crowd) is greatly reduced.

1 Walking through Higashi Hongan-ji   Figure2 Pedestrians' crossing across
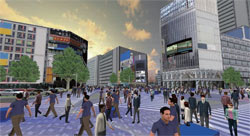
Shibuya scramble crossing

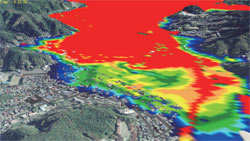
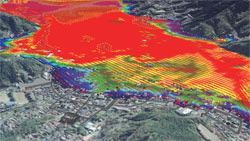
Display of point crowd data
You can import the information collected inside millions of point crowd data measured on-site with 3D laser scanner (highly accurate GPS movement measurement device) to UC-win/Road to confirm the result of visualization from arbitrary direction and to conduct 3D modeling based on the imported point cloud data.

Figure 3 Point cloud data

 Small town model
Mt Parkway.rd
This is a data that visualizes Nihondaira Park Way in Shizuoka Prefecture in which a course of about 8km in the total length is set. It's a light data designed to work even in relatively low end PC.

Assigning Road Surface to particular textures
Asphalt pavement, concrete pavement, and gravel can be selected as road surface; and textures and friction coefficient can be assigned to each road surface.  You can put more details on road surfaces by adding the effect of weather such as rain, snow, or ice to it, allowing you to drive on various road conditions.  The road friction and sound of running vehicle will change according to road surface condition.  The game controller will vibrate when the driver passes over a road bump, a run, potholes, railway tracks, etc.  and the running sound, etc. change according to the road surface condition when running. The vertical vibration (vibration to the game controller) can be experienced by a driving simulation. The game controller equipped with the force feedback function is required to experience this vibration.

Figure 4 Running on gravel road
(You can feel the vibration
when running on a rough road)
Figure 5
Running on the asphalt pavement after the rain.
(Slippery due to lower friction force )

New Whether Visualization
The change in weather such as rain, snow, fog, thunder can be confirmed by the weather scenario. When driving in rain, it is now possible to show rain water flowing on the windshield, windshield wipers wiping water, reflection of vehicle on a puddle, and water splashing from rear tires of a car.

Figure 6
Use of wipers when running in rain
Figure 7
Water splashing and reflection in a puddle

 Highway model
Highway.rd
The data is designed for allowing driving simulation with high performance while securing a high frame rate. A part of Tokyo Metropolitan Expressway section (Roppongi from Shibuya-ku Hatagaya) is reproduced to create a total of about 29km stretch of  road. A driving simulation can be experienced with a game controller or a driving simulator with real auto parts.

Bump function
Version 6 allows the user to set a 'road bump' at a specified position such that when the vehicle passes over the bump, the driver feels it through the controller.
If the 'bump' is set on the rail of a rail track (Figure 18), the controller (steering wheel or gamepad) will vibrate when the driver passes over it. In addition, a more realistic driving effect can be achieved if a 'bump' is set to the edge of the road, between the highway and curb, such that if the driver's wheel hits the curb the effect can be experienced as in real life.

Figure 8 Bump function (Bump is shown in red.)

Improvement of Smoke Visualization
The visualization and movement of smoke and fire inside tunnels is significantly improved in Version 6. During a  scenario in a tunnel, the smoke will appear from a crashed vehicle. As the behavior of smoke is controlled by the simulation considering the space in tunnel and the temperature during fire, the movement of smoke is very realistic. To confirm the movement of smoke, stop driving by clicking "Stop of the scenario" near the scene of the accident.

Figure 9 Visualization of smoke inside a tunnel

Visualization of the result of noise analysis

This is a sample data that assumes the vehicle on the expressway to be a sound source, and is designed to visualize the result of analyzing noise between buildings in 3DVR. The noise analysis function is available in UC-win/Road Ver.6 (A noise simulation option is necessary).  Furthermore, you can obtain the result of analysis in a very short amount of time if you use our high performance computing service via cloud.

Figure 10 Result of noise analysis performed between buildings

 Tsunami analysis model
Tsunami.rd
It is the sample data that visualizes the result of the tsunami simulation analyzed by xpswmm on 3DVR. Kamaishi harbor, Kamaishi city hall, and the surroundings of Kamaishi station and the surroundings of Iwate-cho in Kamaishi city in Iwate is modeled.  Not only can you visualize with a high degree of realism considering the reflection of water surface and inflection, you can also to show the depth of the tsunami by contour and to draw the arrow of flow velocity. To visualize the result of tsunami simulation, xpswmm plug-in Ver.2(for Tsunami) is required (Advanced,Ultimate). Moreover, to visualize it smoothly, high spec video card is required.

Figure 11 Reflection and inflection of tsunami's water surface
Figure 12 Tsunami around the building
Figure 13 Shortly after tsunami
(Contour figure)
Figure 14 A few seconds later from tsunami
(Contour figure)
Figure 15 Flow vector of tsunami
(Up&Coming '12 New Year Issue)

FORUM8