New Products
UC-win/Road Ver.8
3D realtime VR software package

●Price New Ultimate:
Driving Sim:
Advanced:
Standard:
US$15,000
US$12,000
US$9,000
US$5,800
Version Up Ultimate:
Driving Sim:
Advanced:
Standard:
US$1,500
US$1,500
US$800
US$800
●Released October 2012
UC-win Series
Simulation
Introduction
UC-win/Road is a realtime VR software which can create the large scaled 3D space and VR (Virtual Reality) with an easy procedure and operation. In Ver.8 which is to be released, the function expantion and improvement has been conducted like following.
LOD has been applied in 3D model.
LOD (Level Of Detail) is a technology changing the quality of things to be drawn according to the difference from a viewpoint. The display of character had had LOD function conventionally, but the LOD function is now applied in 3D model and FBX scenet model in Ver.8. If it becomes to some extent far, even if it is a high quality model, it becomes almost impossible to distinguish in a drawing in 3D environment. This is because it will be drawn small if the distance from a viewpoint becomes far. A LOD function uses this and applies a low quality (few polygons) model with a small drawing load to a model far from the viewpoint. Therefore it is possible to improve the whole drawing performance without changing the quality of what it looks.

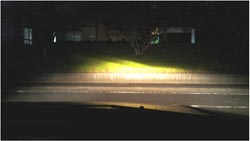
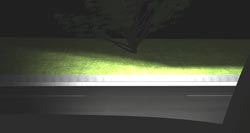
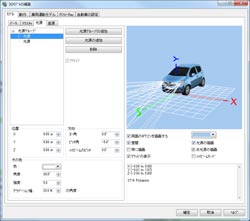
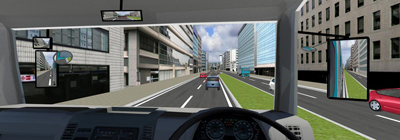
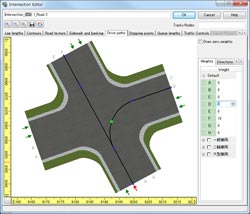
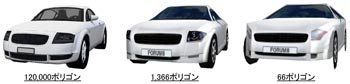
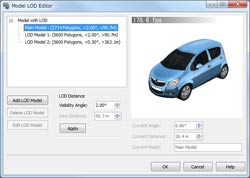
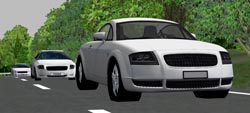
In order to use the LOD function, prepare the models with different qualities as shown in Figure 1. Next, in the setting screen of Figure 2, set the distance between the models with a viewing angle. Thereby, a model in 3D environment changes automatically according to the distance. Figure 3 is the example showing this. Although the distant model is a low-quality one, it does not look like that. In addition, since the LOD model can be set in many stages, please use this function by adjusting the balance between the quality and speed of the drawing.

Click the image for a larger picture. Click the image for a larger picture. Click the image for a larger picture.
Figure 1 Models with qualities of 3 stages Figure 2 
Setting screen of LOD model
Figure 3 
Example setting the LOD model in 3 stages

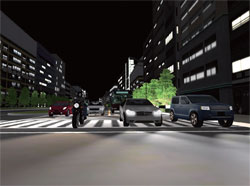
Table 1 is the result of measuring fps of the whole scene of the created sample. Only by applying about 100 sets of LOD(s), 13 to 19% of improvement effect is acquired on the whole scene. Furthermore, if it applies also to models, such as a building, bigger performance improvement can be realized.

without LOD(fps) with LOD(fps) Inprovement rate (%)
Case 1 38 43 13%
Case 2 26 31 19%
■Table 1 Comparizon for performance of 100 models

Expansion of driving simulation function
UC-win/Road carries the vehicles movement model which performs physical calculation of high- accuracy vehicles by default and it is possible to calculate considering engine, transmission, the weight of a vehicle, vehicle's center of gravity and the coefficient of friction of a tire etc. The more realistic driving simulation can now be performed in this revision.

1. Torque converter
There has been significant improvement in that the characteristic of torque converter (hydraulic rotary converter) , which tranfers rotating power from an engine to the transmission, are modeled very precisely in car with an automatic transmission.

Click the image for a larger picture. Click the image for a larger picture.
Click the image for a larger picture.
Figure 4 Comparizon of gear change timing (above: Ver.7, below: Ver.8) Figure 5 Setting screen of gear change algorithm

2. Improved gear change algorithm
Algorithm of gear change timing has been improved.

3. ABS
ABS (Anti-lock Braking System), a system that allows the wheels on a vehicle to maintain tractive contact with road surface according to driver inputs while braking preventing the wheels from locking up and avoiding skidding, is now supported.

4. Clutch operation in a car with manual transmission has been improved
The concept of half clutch control has been added.
Improvement of terrain generation feature
今回の改訂では、従来よりご要望の多かった地形の生成機能の拡張を行いました。

1. Generation of large-scale terrain
Large-scale terrain (exceeding area of 100km) can be generated (Figure 6).

Click the image for a larger picture.
Figure 6 Example of large-scale terrain
(from Tokyo to Nagoya)

2. Terrain size can be altered flexibly
Any region within the map can be specified and generated easily (Figure 7).

Click the image for a larger picture.
Figure 7 Specifying the range of terrain generation

3. More formats are supported
Formats below can now be imported.
 ・SRTM90 (90m mesh)
 ・ASTER (30m mesh)
 ・BlueMarbleNextGeneration(500m mesh) *Seabed is also available

4. Assign resolution of terrain
Resolution (number of patches) of terrain that need to be generated can be specified.
Tsunami plug-in
This is a general purpose plug-in (an option that can be purchased with additional fee) that visualizes various simulations results such as the result of tsunami analysis code developed by a university or research institutions or the result of tsunami analysis program on the market.

  • We publicized open format unique to FORUM8. Results in any format can be converted for visualization.
  • Terrain mesh data used for analysis can also be imported.
  • Contour map showing water depth, flow velocity, wave strength, reflection on water surface, ripples, etc. can be visualized in a very realistic manner.

Click the image for a larger picture. Click the image for a larger picture.
Figure 8 Contor display with the depth of flood Figure 9
Expression by the reflection of water surface

*It will be released in UC-win/Road Ver.8.0.1.
Log Output Plug-in
We developed a new plug-in that logs the information on the coordinates, orientation, velocity, steering angle, etc. of driven vehicle (option that can be purchased by additional fee). Traffic flow and characters can also be output to CSV file format. The plug-in also has the ability to output UDP in real-time via network.

Log output data
Basic data Simulation time, model name, model ID, model type
Coordinates, position X coordinate, Y coordinate, Z coordinate, pitch angle, yaw angle, roll angle, vector
Power, velocity Engine RPM, gear number, velocity (km/h, m/s), speed limit
Input Steering angle, accelerator position, brake position, autonomous driving
Table 2 Example of log output data

 Supports FBX 2013
Latest version of FBX file (FBX 2013) can now be imported. Collada file (*.dae) can now be imported much faster and its result are shown much more accurately. Many data including the ones created by SketchUp and 3D Gallery can now be used.

Click the image for a larger picture.
Figure 10 Importing the sample data of SketchUp (Import it after converting to Collada file)

Improvement of headlight display
After a research on headlight standards in Japan and overseas, range of exposure and illumination pattern have been improved to express exposure from headlights in a much more realistic manner. You can now switch around between low beam and high beam.

Click the image for a larger picture. Click the image for a larger picture.
Figure 11 Head light by an actual vehicle
(taken by FORUM8)
Figure 12 Headlight of UC-win/Road

Lighting feature has been enhanced
Light can now be assigned to any place on the 3D model, allowing users to add fog lamp and back lamp to their vehicle. Furthermore, headlights on vehicles within a traffic network or scenario can now be shown.

Click the image for a larger picture. Click the image for a larger picture.
Figure 13 Defining the light of a model Figure 14 Expression of light in a traffic flow

Number of mirrors
From Ver.8, you can specify as many mirrors as you want. Therefore, cockpit with many mirrors such as that of trucks and other heavy vehicles can now be visualized much more accurately.

Click the image for a larger picture.
Figure 15 Example of setting 6 mirrors

Waypoint on an intersection
Waypoint can now be added in an intersection, allowing you to control vehicle speed within a traffic network or switch from one event to the another during a scenario.

Click the image for a larger picture. Click the image for a larger picture.
Figure 16 Waypoint on an intersection

Vertical Railway Curve
Parabola of road and arc of a circle depicting a railway curve can now be drawn.

Click the image for a larger picture.
Figure 17 Setting screen of vertical curve

Cluster scenario: Multimedia shown all on all PC
Previously, multimedia (image, video, text) were displayed only on control PC when you were running a scenario using cluster option (option sold separately), , but from ver.8, multimedia are shown on slave PCs as well.

Click the image for a larger picture.
Figure 18 Example of scenario screen of cluster
Improvement of sound effect
Vehicle sounds are much more realistic now that sound files of medium-sized vehicles have been improved and default sound profile of traveling vehicle has been improved.
Improvement of scenario feature
You can now control EXODUS plug-in and Micro Simulation player plug-in using the scenario feature.

Click the image for a larger picture.
Figure 19 Controlling EXODUS in scenario

 Finally
We will continue to improve the drawing performance and traffic simulation etc. Please look forward to it.
(Up&Coming '12 Fall Issue)
戻る
Up&Coming

FORUM8