Support Topics
 Support Topics・ UC-win/Road

Enhanced functions to import and display point cloud

Maintenance/Support Service Information

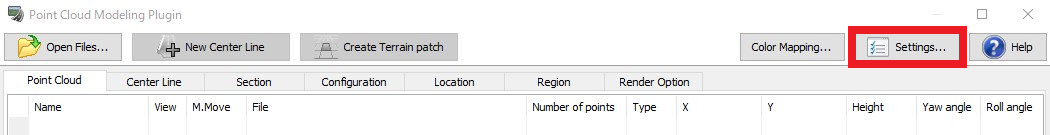
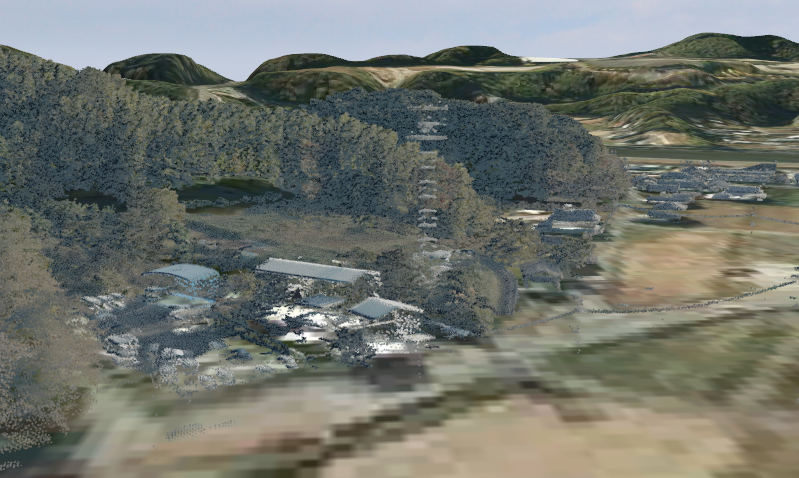
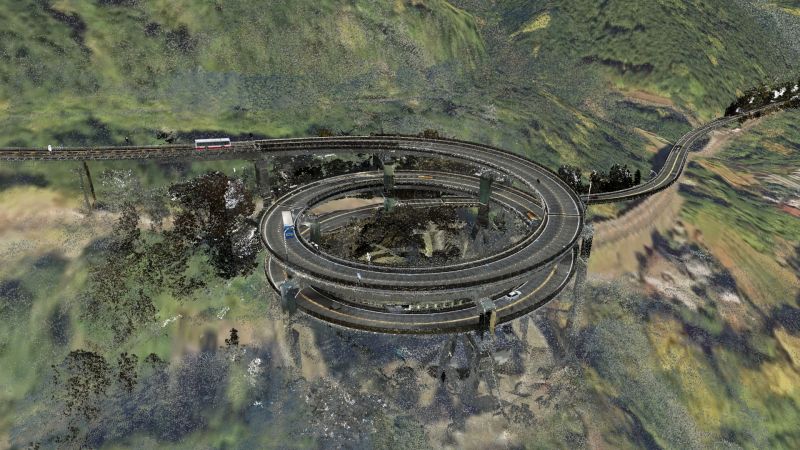
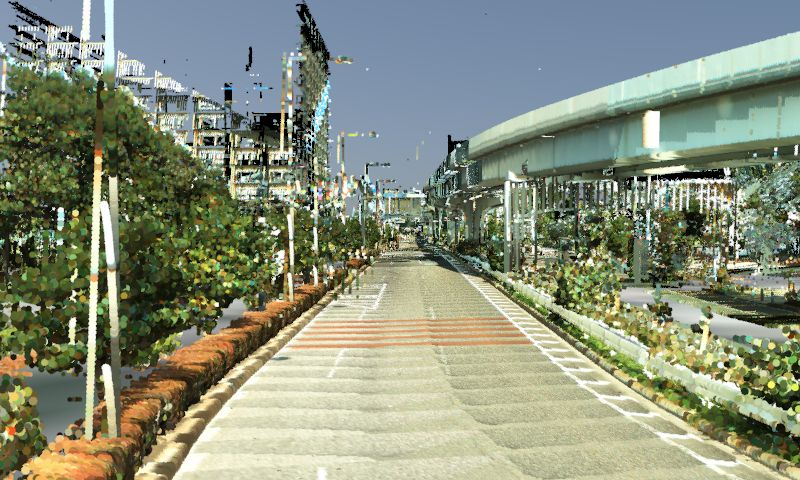
After equipped with the point cloud display function on Ver.5 released in 2010, UC-win/Road has realized cooperations between point cloud and various data in VR space.

This year, point cloud data of each area has been in public, and the chance of utilizing point cloud data is increasing. In this topic, we introduce the point cloud function that has been enhanced up to Ver.14.


Import Point Cloud Data

The Point Cloud Modeling Plug-in helps users to import point cloud data and display it in real time on the 3DVR environment. Point cloud data can be divided into 2 types: the fixed type that is measured with fixed type laser scanner and the MMS type that is measured with Mobile Mapping System (MMS). The both types of point cloud can be used in UC-win/Road. For example, you can display objects along the roads in MMS format and compensate the places not measured enough with fixed data.

As file format, classified separately from the measurement method, there are text format files such as .csv/.xyz/.txt and the binary format files such as .las. From ver.13.1.0, not only text files but also point clouds in LAS files can be read.


1. Import setting

Before importing point cloud, settings according to the format used are required. Click "Settings" on the upper right of "Point Cloud Modeling Plugin" screen.


Fig.1 Point Cloud Modeling Plugin

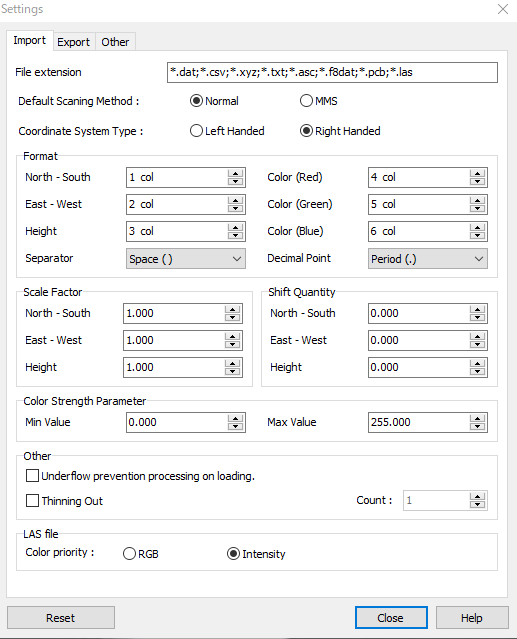
The point cloud setting screen opens. Point cloud format, coordinate system, and color parameter can be set here.


Fig.2 Point cloud import setting screen

  1. Default Scanning Method: Specify the counting method of point cloud data file to be read from the fixed type or MMS.
  2. Coordinate System Type: Specify which of the coordinate system of the imported data uses from the right hand rule or the left hand rule.
  3. North - South: Specify in which column the coordinate of North-South axis is.
  4. East - West: Specify in which column the coordinate of East-West axis is.
  5. Height: Specify in which column the elevation is.
  6. Color (Red): Specify in which column the R (Red) value is.
  7. Color (Green): Specify in which column the G (Green) value is.
  8. Color (Blue): Specify in which column the B (Blud) value is.
  9. Separator: Select the mark to separate data items.
  10. Decimal Point: Specify the decimal point mark.
    [Space () / Comma (,) / Period (.) / Tab (\t)]
  11. Color Strength Parameter: Set the maximum and minimum value of the color strength of point cloud data to be imported. (Min 0 and Max 255 in default)

Fig.3 Example of point cloud data file format

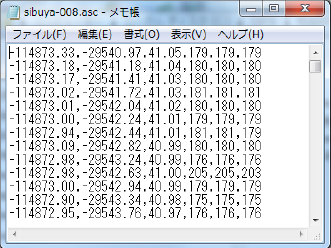
In the point cloud data file shown in the figure 3, the data separator is comma (,) and the decimal point is period (.). In point cloud data files, one line shows the information of one point, including the following data.

  1. x coordinate
  2. z coordinate
  3. y coordinate (height)
  4. R value (red constituent)
  5. G value (green constituent)
  6. B value (blue constituent)

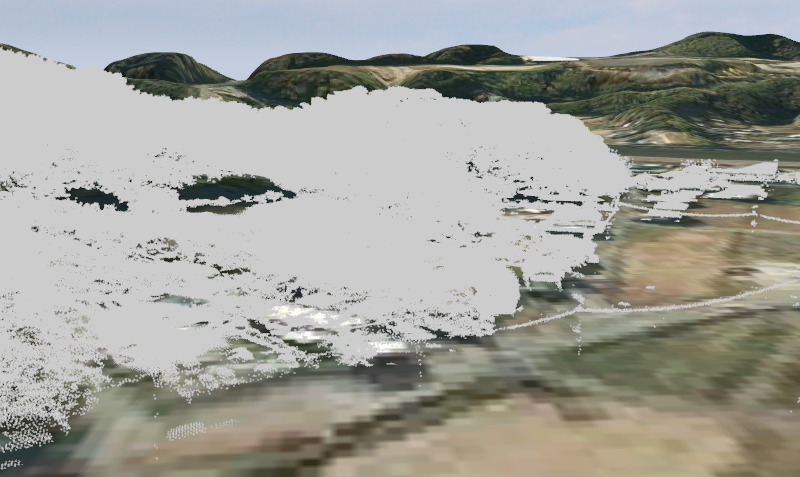
Type and order of data included in each line differs by kinds of 3D laser scanner and processing of measurement data. Each line may contain data other than the 6 items and may have different column order. If you use text data, you have to check which data is in which line so that point clouds will be put on the correct position and be displayed in the correct colors.

After finishing the configuration, close the setting screen and click "Open Files" on the upper left of the plugin screen to import point clouds. Several files can be loaded. When importing LAS files, the text format setting is not required.


2. Point cloud color setting

If imported point clouds are displayed in black and white, the color strength value in the data may be out of the range set in the color strength parameter. Confirm that the data contains RGB information, set the lines properly, and enter 255 in the maximum value of the color strength parameter. If colors are still not displayed, enter 65536 in the maximum value and import the data again. If the brightness information data, not RGB, is displayed with a bias toward extreme white or black, try to change the maximum value of the parameter in the same way.


Max value of color strength parameter: 255 Max value of color strength parameter: 65536
Fig.4 Max value of color strength parameter*1

3. LOD of point cloud

LOD can be set for point clouds imported by the fixed type. "LOD" setting items are on "Render Option" tab in "Point Cloud Modeling Plugin" window. The range of point clouds to be displayed can be adjusted by inputting values in the start and end distance or sliding the bar. To set the value with the slide bar, click "S" to decide the starting distance and "E" for the end distance.

If the software is slow after importing a huge amount of point cloud, please set the point cloud LOD. The MMS type point cloud does not corresponds to LOD function since it is linear extract. If you do not need the MMS type point cloud, please change Default Scanning Method to "Normal" and reload to do the LOD setting.

Fig.5 LOD setting

LOD S:50 E:200 LOD S:50 E:999
Fig.6 Comparison of LOD*2

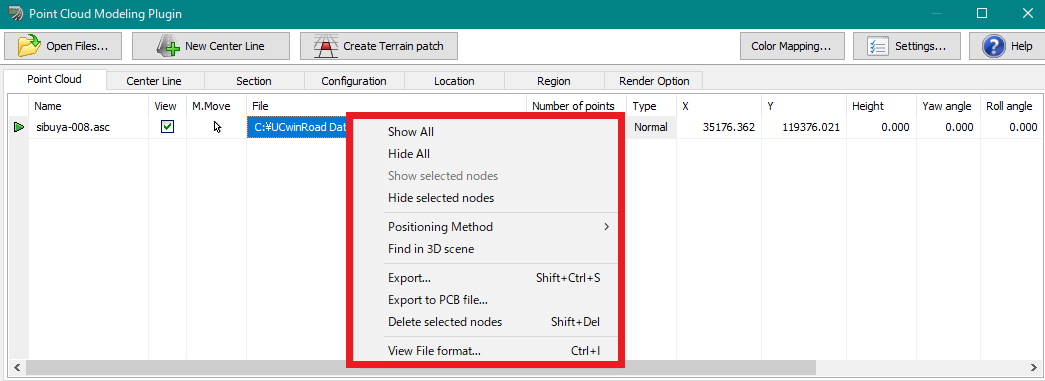
4. Right click menu on the point cloud list

On the "Point Cloud" tab of the "Point Cloud Modeling Plugin" screen, select a point cloud and right-click to display the menu.


Fig.7 Right click menu

  1. Show/Hide several point clouds
    You can show/hide each point cloud with "View" check box. To switch the display of many points at once, select several nodes and "Show/Hide selected nodes" on the right-click menu.
  2. Go to any point cloud position
    When importing much point cloud data, it takes long to find where each point cloud is located. In that case, select a point cloud and click "Find in 3D scene" in the right-click menu. The camera shows the position of the selected point cloud from above.
  3. Check point cloud format
    You can make individual settings when importing point clouds. If you want to know each setting of loaded point cloud later, select the point cloud and click "View File format" at the bottom of the right-click menu.
  4. Export
    You can export and save point clouds. The export settings are in "Settings" - "Export" tab.

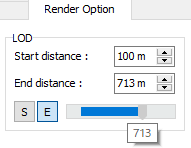
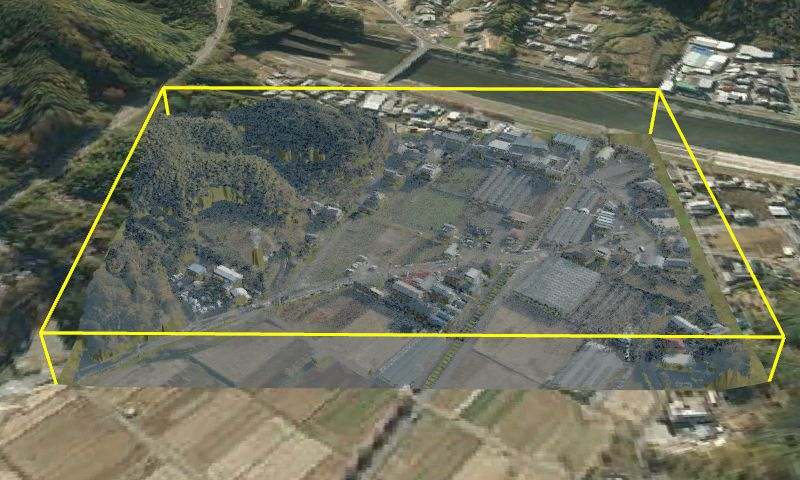
5. Terrain patch creation

You can convert point cloud data into terrain patch by clicking "Create Terrain patch" on the top of "Point Cloud Modeling Plugin" window. The point reduction interval and the data range can be changed.


Create terrain patch within point cloud range Hide point clouds after creating terrain patch
Fig.8 Creation of terrain patch*1

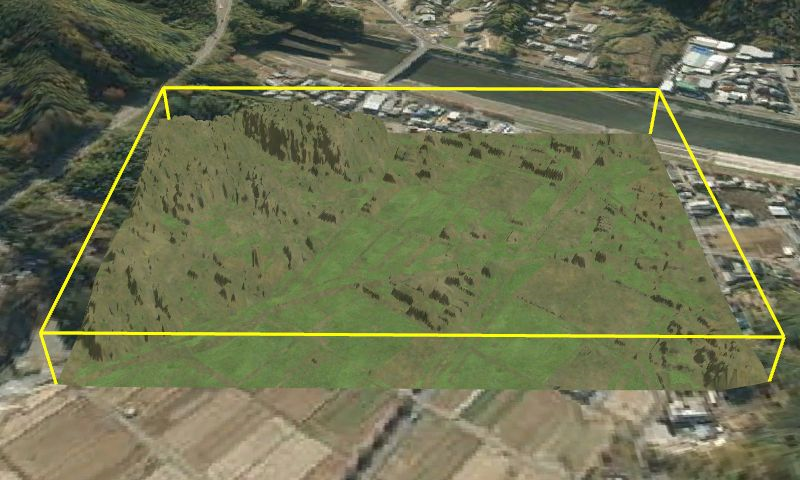
Utilization of open data

You can import and use open point cloud data in UC-win/Road. The followings are the websites providing free point cloud data.


・Shizuoka Point Cloud DB

https://pointcloud.pref.shizuoka.jp/
Point cloud data measured for constructions in Shizuoka can be downloaded. As an example, we imported the point cloud data of Kawazu Nanadaru Loop Bridge, created the road based on it, and conducted driving simulation.


Fig.9 Simulate Kawazu Nanadaru Loop Bridge by using point clouds*2

・Geoinformation Science Research Team, Artificial Intelligence Research Center (AIRC), Department of Information Technology and Human Factors, The National Institute of Advanced Industrial Science and Technology

https://www.airc.aist.go.jp/gsrt/3ddb-viewer.html
Point cloud data of Odaiba in Tokyo, Tsukuba center in Ibaraki, etc. measured by several methods can be viewed and downloaded.


Fig.10 Data of Odaiba, Tokyo*3

Point cloud data measured in all over Japan including Shizuoka and Hyogo is registered on the website below.

・MLIT Data Platform https://www.mlit-data.jp/platform/

・G space information center https://www.geospatial.jp/gp_front/

Public open data has made point clouds more familiar to us. Let's start utilize it.


Point cloud data source

  1. Association for Promotion of Infrastructure Geospatial Information Distribution (AIGID)
    G space information center "Point cloud data of the Southeast area of Mt. Fuji and East area of Izu, Shizuoka"
    https://www.geospatial.jp/ckan/dataset/shizuoka-2019-pointcloud/resource/7b986b95-c5a0-4a14-823c-129de28ee2a8

    MESH_NO(08NE5905,08NE5906,08NE5915,08NE5916)


  2. Shizuoka Point Cloud DB
    https://pointcloud.pref.shizuoka.jp/

  3. Association for Promotion of Infrastructure Geospatial Information Distribution
    3DDB Viewer (https://gsrt.airc.aist.go.jp/3ddb_demo/tdv/index.html)


Previous
 
Index
(Up&Coming '20 Fall issue)
Back
Up&Coming

FORUM8

LOADING