| Support Topics | ||
| Support Topics・ UC-win/Road | ||
|
||

|
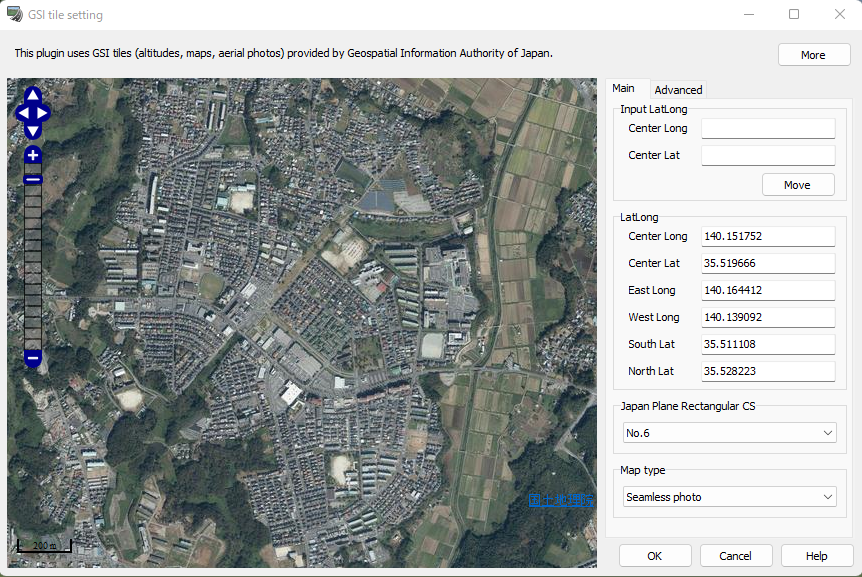
The Digital Garden City State Concept currently being promoted by the government will be introduced, with examples of UC-win/Road's functions and applications that support the construction of this concept. Open data can be used to build a digital garden city, enabling the visualization and simulation of a digital twin according to local realities. Here is an example of a data creation flow that will serve as a platform. Approaches to the Realization of a Digital Garden City State: Seven Types of Approaches(https://www.forum8.co.jp/product/gardencity.htm) Topography acquisition (Geographical Survey Institute tiles) There are various ways to generate terrain in UC-win/Road. Among them, acquiring terrain by "loading Geographical Survey Institute tiles" allows you to directly select an area while viewing the map. It is also possible to generate terrain with aerial photos attached. Open the "Geospatial Tile Range Setting" screen from the menu "File" - "New Project" - "Import Geospatial Tile", set the acquisition range by zoom level and window size, and load the image as a "seamless photo". If you want a higher resolution than the displayed image, increase the value of "Zoom Level Offset" in the "Additional Settings" tab.
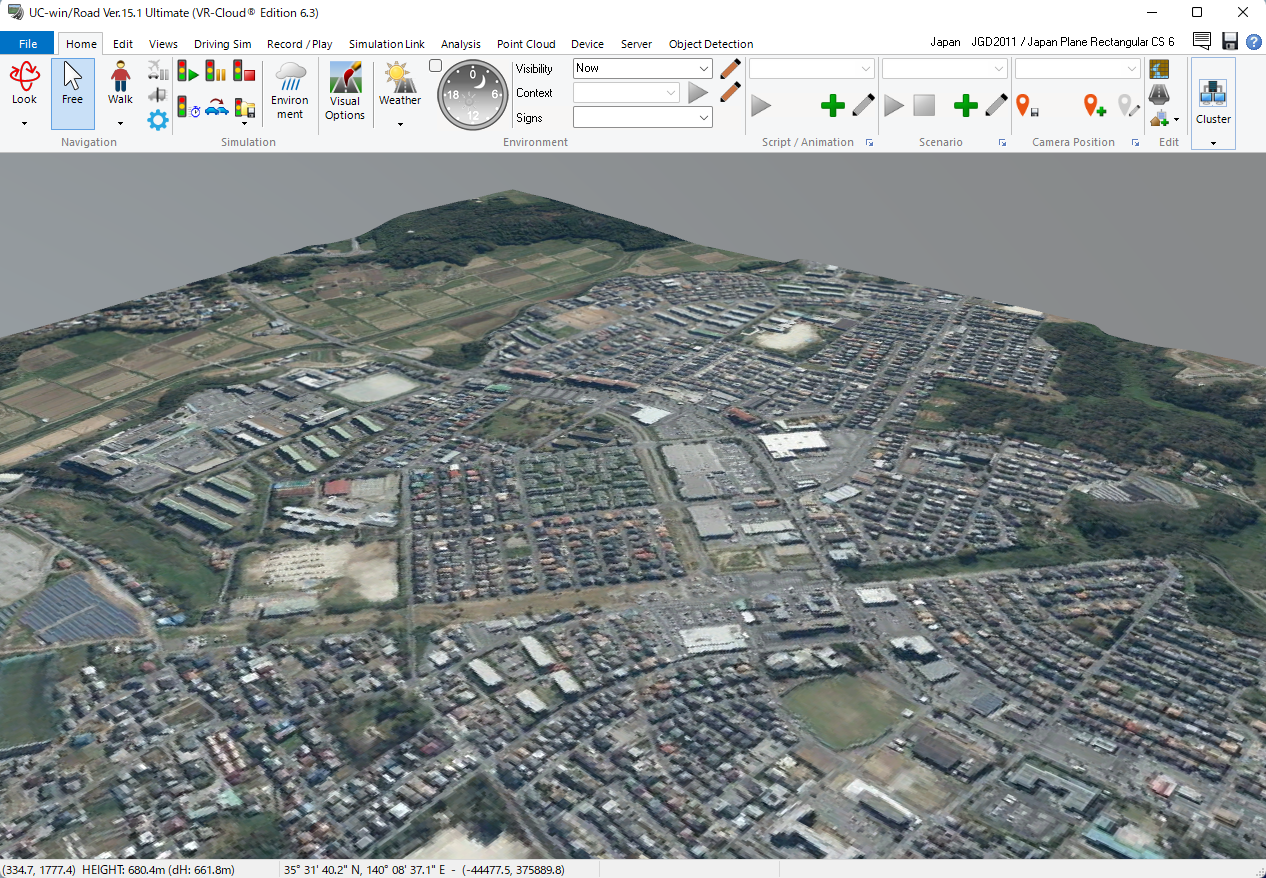
Elevation information and GSI tile images are downloaded and the terrain is generated.
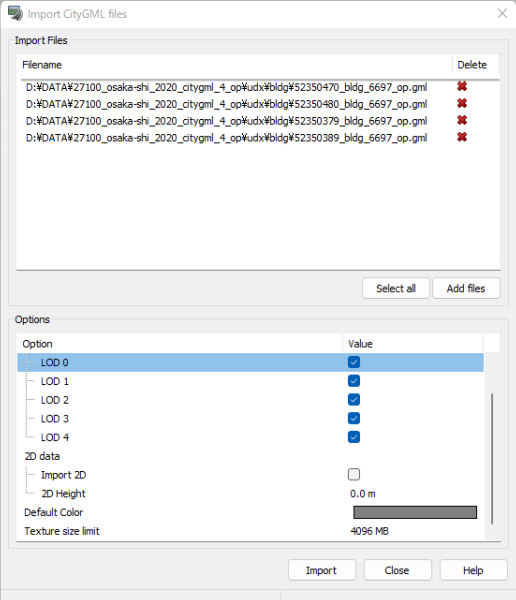
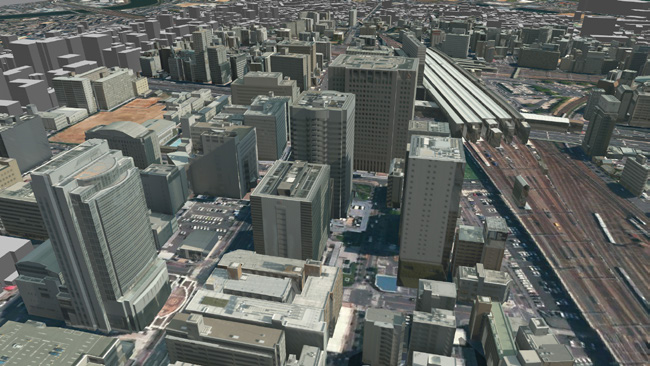
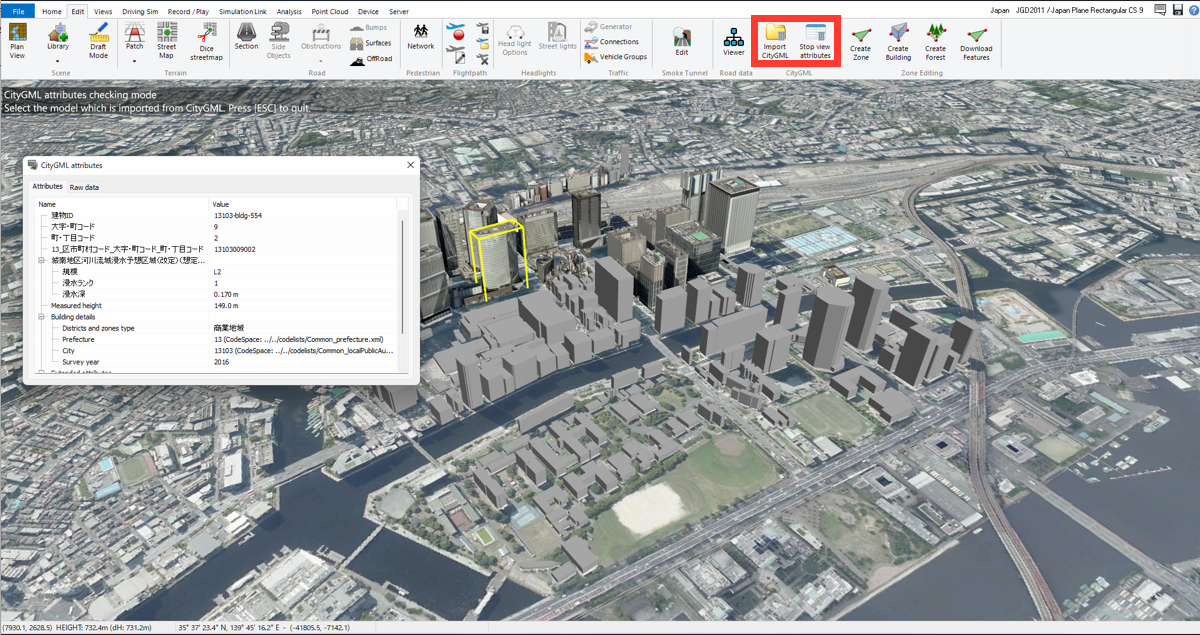
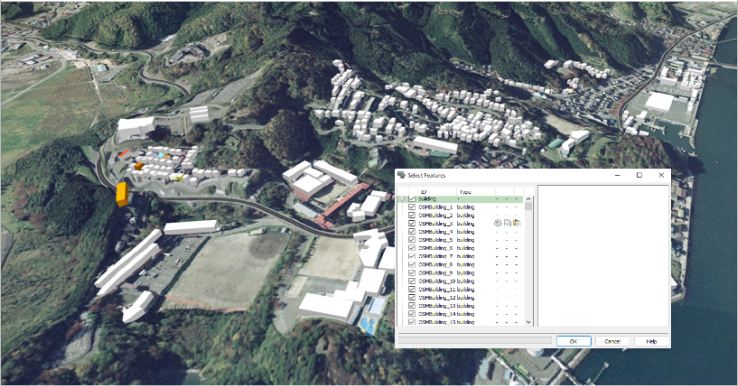
Arrangement of urban models(PLATEAU:CityGML) UC-win/Road ver.16 can directly read CityGML format models, the data format of PLATEAU, a 3D city model project maintained by the Ministry of Land, Infrastructure, Transport and Tourism. The building model is automatically placed after selecting and importing a CityGML file of the target scope after selecting the menu "File" - "Import" - "Import CityGML". The LOD1 model is a box-like model with its height, whereas the LOD2 model can be viewed with the roof of the building defined and textured.
You can select a placed model and check its attribute information. Clicking on a CityGML model in the menu "Edit" - "Start Attribute Display" will display the attribute information contained in that model.
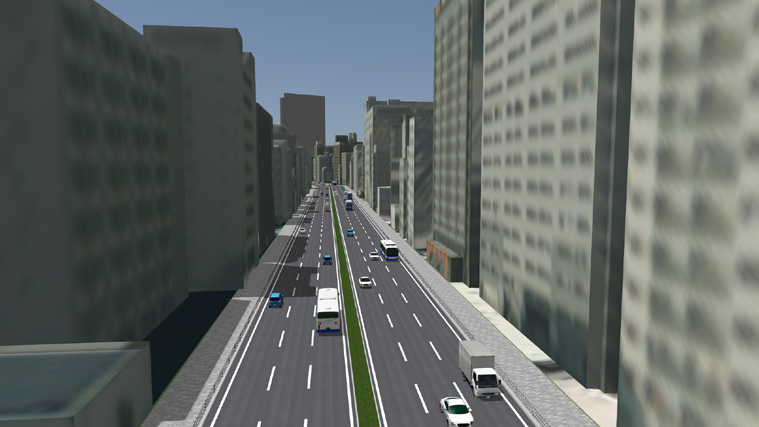
Once the building model is placed and roads are created, the basic structure of the town can be created. By setting up tracks, stations, parking lots, etc., traffic and logistics can be simulated.
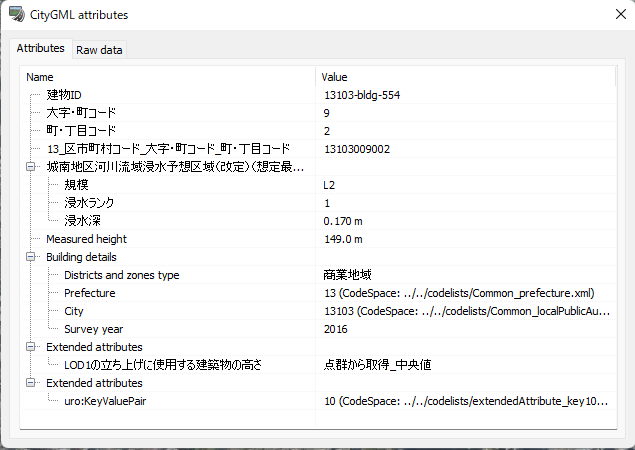
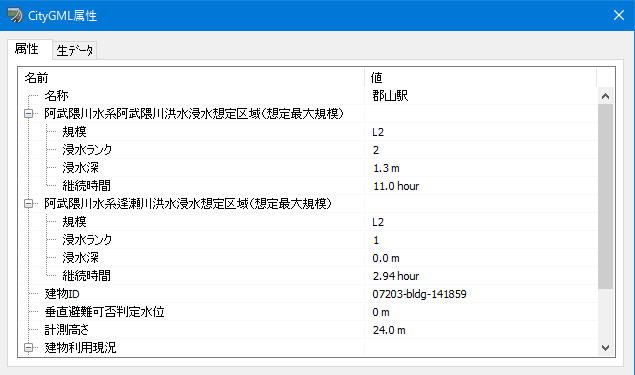
If the building model includes flood or tsunami inundation forecast information, information such as inundation depth and duration can be viewed.
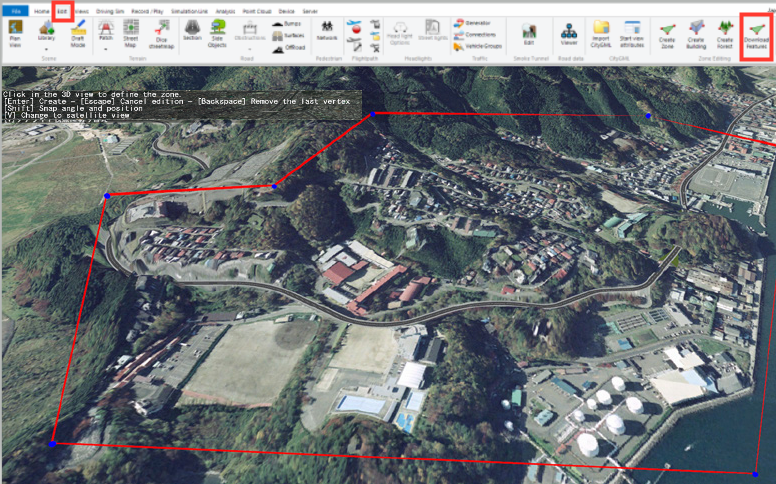
Figure 8: Example of inundation forecast information of PLATEAU model attributes Download geographic features (OpenStreetMap data) In addition to PLATEAU, you can freely define and download ranges of OpenStreetMap (OSM) data and place buildings and forests. Select the range and download by using the menu "Edit" - "Download Geotechnical Objects".
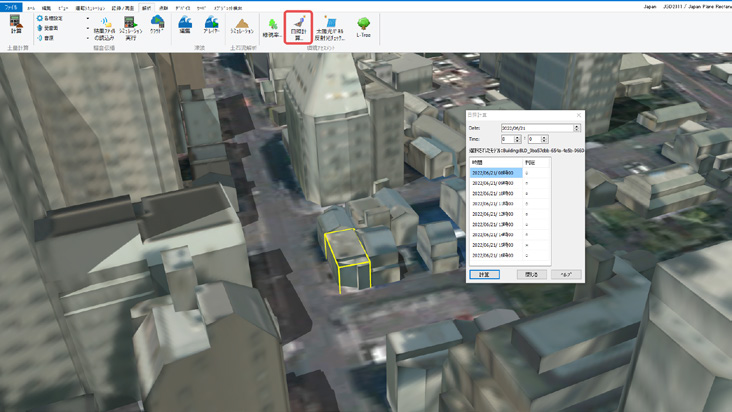
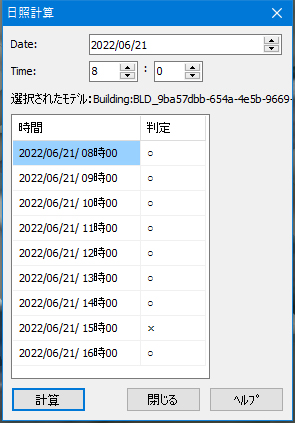
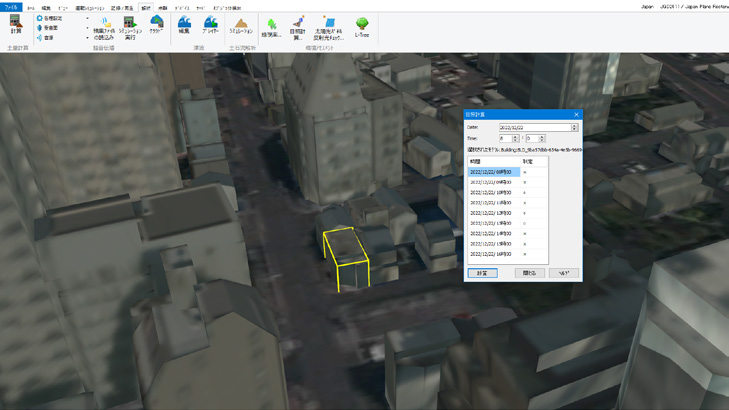
For areas where building information is not available in PLATEAU or OSM, building models can be converted to Shapefile format and imported from the GSI's basic map information. Environmental impact assessment Simplified assessments can be performed by utilizing the real-time simulation capabilities of UC-win/Road. Assessments can be made for green visibility, sun exposure, and reflected light projections. Here, the sunlight calculations are performed based on the PLATEAU building model. For example, for a building in the location shown in the following figure, there is no sunlight disturbance except for one hour from 3:00 p.m. during the summer solstice, but during the winter solstice, the building is in the shadow of surrounding buildings more of the time.
Figure 12: Daylight calculations: example of summer solstice
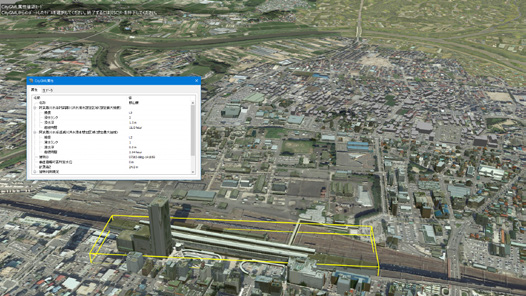
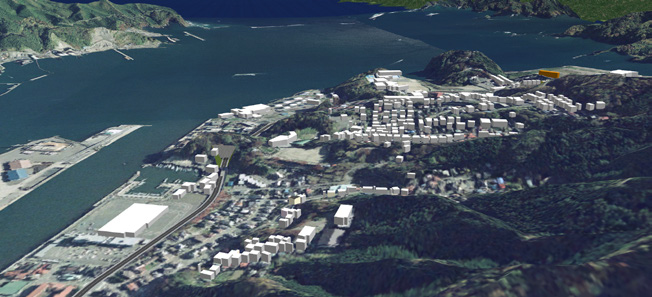
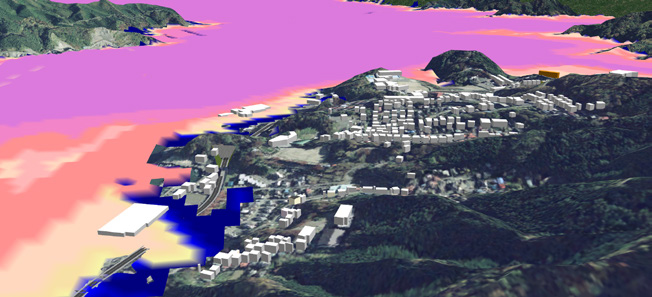
Figure 13: Daylight calculation: Winter solstice example 3D Hazard Map UC-win/Road can visualize various hazard maps in 3D; by placing PLATEAU and OSM building models and visualizing predictions of tsunami and inundation depths, etc., it is possible to determine the relationship between the height of buildings and the speed of inundation, which can be used for disaster prevention and evacuation planning.
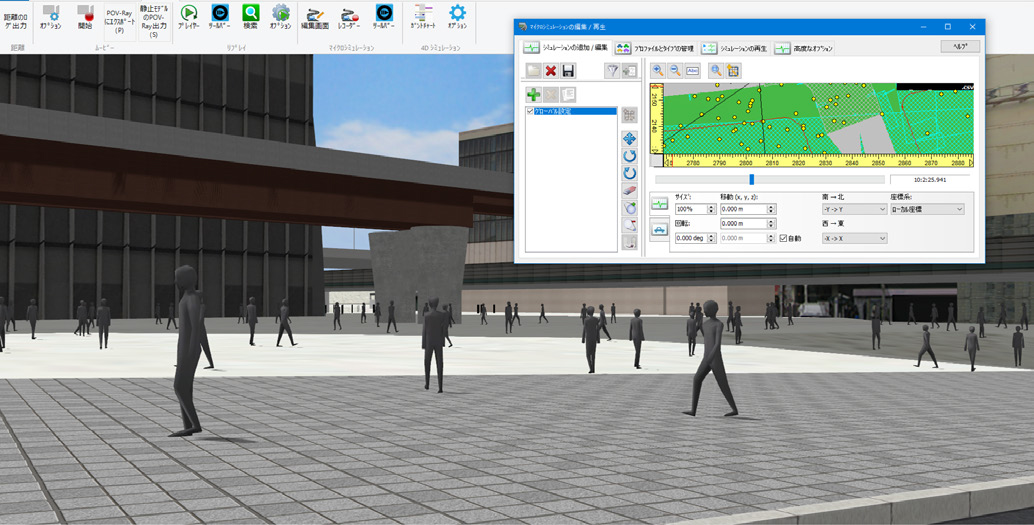
Human flow data loading UC-win/Road can read and visualize human flow data provided by cell phone companies, map information companies, IT companies, local governments, public agencies, etc., in various forms using the microsimulation player function. The data can be used for a wide range of applications such as traffic maintenance, marketing, tourist flow, and evacuation planning.
|